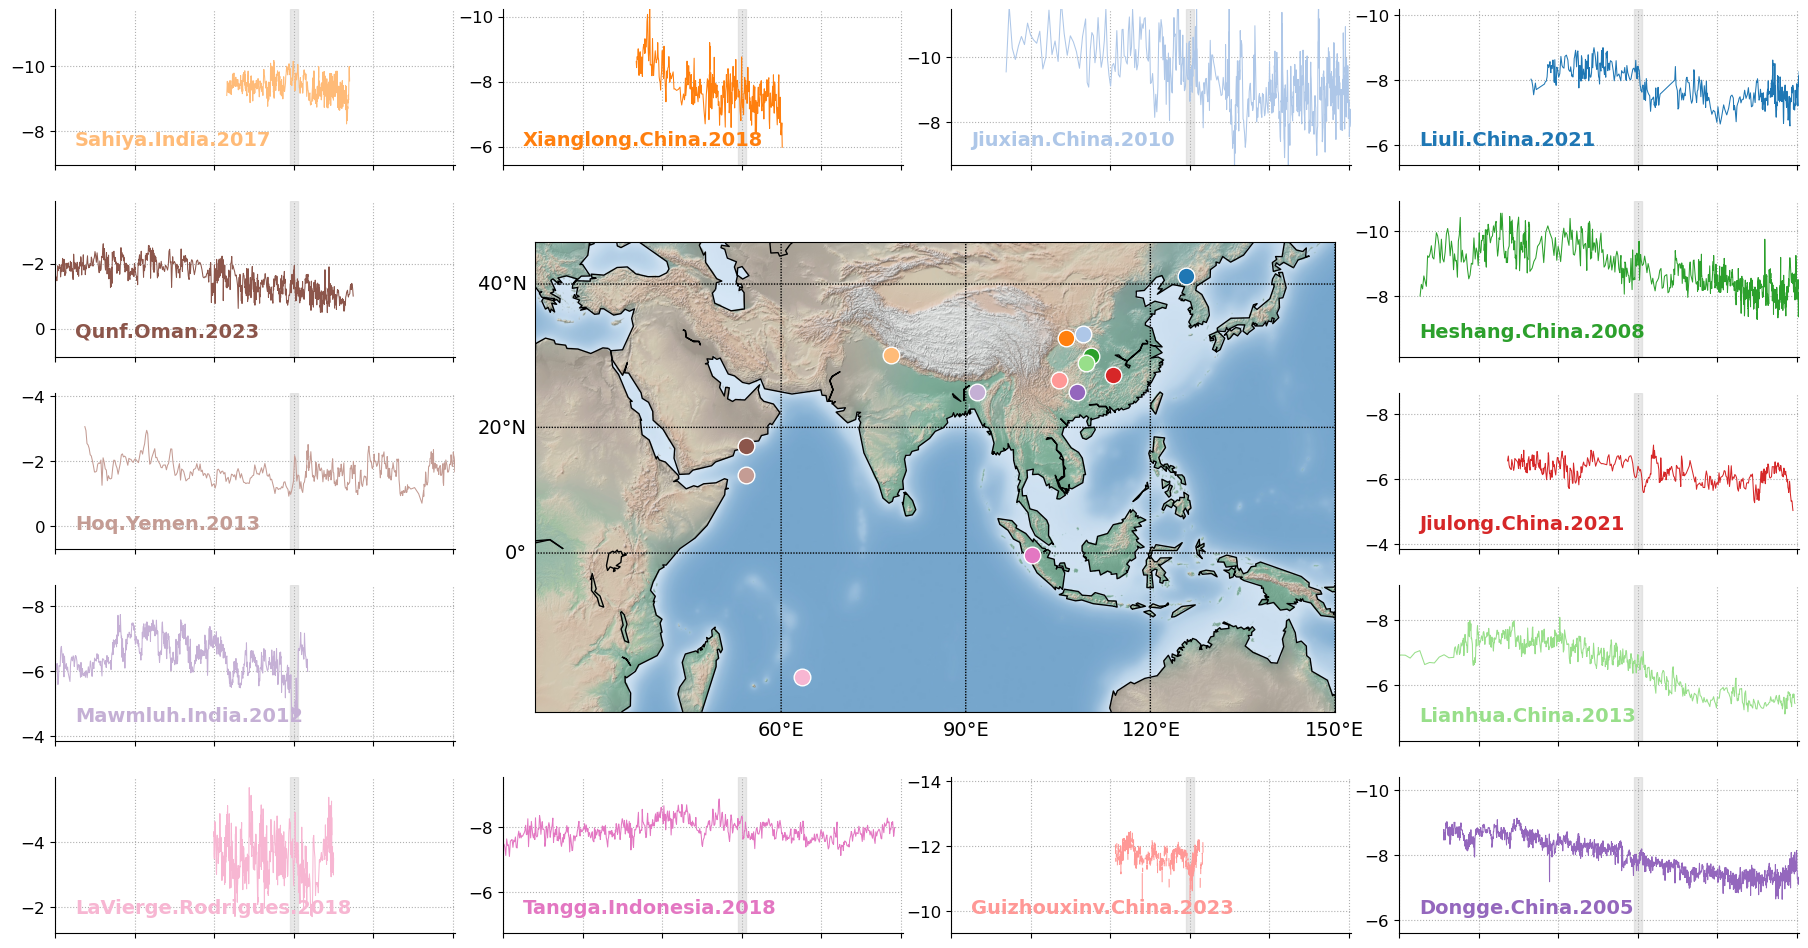
Record Map#
This notebook is intended to reproduce the map figure from the paper.
Note: This notebook assumes the existence of pickle files that need to have been created previously. If you are running this notebook on your machine, make sure you’ve successfully run both of the notebooks in the Loading Data folder.
import pickle

import pyleoclim as pyleo
import numpy as np
import matplotlib.pyplot as plt
import seaborn as sns

from mpl_toolkits.basemap import Basemap
with open('../../data/pickle/series_dict.pkl','rb') as handle:
    series_dict = pickle.load(handle)
# Sort by latitude

lat_dict = {series.lat:series.label for series in series_dict.values()}

sort_index = np.sort(np.array(list(lat_dict.keys())))[::-1]
sort_label = [lat_dict[lat] for lat in sort_index]
series_dict = {label:series_dict[label] for label in sort_label} #Sort by latitude
lats = [series.lat for series in series_dict.values()]

ms = pyleo.MultipleGeoSeries([series for series in series_dict.values()])
# Create a figure with a specified size
fig = plt.figure(figsize=(16, 12))

# Create a Basemap instance with specified projection and map boundaries
m = Basemap(projection='merc', llcrnrlat=-25, urcrnrlat=45, llcrnrlon=20, urcrnrlon=150, lat_ts=20, resolution='c')

# Add shaded relief to the map
m.shadedrelief(scale=0.5, zorder=0)

# Draw coastlines on the map
m.drawcoastlines()

# Draw parallels (latitude lines) on the map
m.drawparallels(np.arange(0., 61., 20.), labels=[1, 0, 0, 0], fontsize=14)

# Draw meridians (longitude lines) on the map
m.drawmeridians(np.arange(60., 151., 30.), labels=[0, 0, 0, 1], fontsize=14)

# Sort the longitude and latitude values based on the order of series_dict keys
lon_2k_sorted = [series.lon for series in series_dict.values()]
lat_2k_sorted = [series.lat for series in series_dict.values()]

# Convert longitude and latitude to map coordinates
x2, y2 = m(lon_2k_sorted, lat_2k_sorted)

# Define properties for text boxes
props = dict(boxstyle='round', facecolor='white', edgecolor='none', alpha=0.5)

# Create a color palette for the series
clrs = sns.color_palette('tab20', n_colors=len(ms.series_list))

# Plot the locations on the map
for i in range(14):
    m.plot(x2[i], y2[i], 'o', markersize=12, color=clrs[i], markeredgecolor='white', markeredgewidth=1)

# Adjust the subplot layout
plt.subplots_adjust(left=0.2, bottom=0.25, right=0.7, top=0.75, wspace=0, hspace=0)

# Create individual axes for each series
ax1 = fig.add_axes([0.74, 0.76, 0.25, 0.13])  # Liuli, top right2
ax2 = fig.add_axes([0.46, 0.76, 0.25, 0.13])  # Jiuxian, top right2
ax3 = fig.add_axes([0.18, 0.76, 0.25, 0.13])  # Xianglong, top left 1
ax4 = fig.add_axes([-0.1, 0.76, 0.25, 0.13])  # Sahiya, top left2
ax5 = fig.add_axes([0.74, 0.6, 0.25, 0.13])  # Heshang, center upper right
ax6 = fig.add_axes([0.74, 0.28, 0.25, 0.13])  # Lianhua, center lower right
ax7 = fig.add_axes([0.74, 0.44, 0.25, 0.13])  # Jiulong, right
ax8 = fig.add_axes([0.46, 0.12, 0.25, 0.13])  # Guizhouxinv, bottom right 1
ax9 = fig.add_axes([0.74, 0.12, 0.25, 0.13])  # Dongge, bottom right 2
ax10 = fig.add_axes([-0.1, 0.28, 0.25, 0.13])  # Mawmluh, center lower left
ax11 = fig.add_axes([-0.1, 0.6, 0.25, 0.13])  # Oman, center upper left
ax12 = fig.add_axes([-0.1, 0.44, 0.25, 0.13])  # Hoq, left
ax13 = fig.add_axes([0.18, 0.12, 0.25, 0.13])  # Tangga, bottom left 1
ax14 = fig.add_axes([-0.1, 0.12, 0.25, 0.13])  # LaVierge, bottom left 2

# Store the axes in a list
axs = [ax1, ax2, ax3, ax4, ax5, ax6, ax7, ax8, ax9, ax10, ax11, ax12, ax13, ax14]

# Iterate over the series and plot them on the corresponding axes
for i, key in enumerate(series_dict.keys()):
    series = series_dict[key]
    axs[i].axvspan(4100, 3900, color='lightgrey', alpha=0.5)
    series.plot(color=clrs[i], linewidth=.75, ax=axs[i], legend=False)

    # Set x-label for specific series
    if key in ['LaVierge', 'Guizhouxinv', 'Tangga', 'Dongge']:
        axs[i].set_xlabel('Year (BP)', fontsize=12)
    else:
        axs[i].set_xlabel('')
        axs[i].set_xticklabels([])

    # Set tick parameters and grid style
    axs[i].tick_params(axis='both', which='major', labelsize=12)
    axs[i].grid(linestyle='dotted')

    # Set y-label for specific series
    if key in ['Oman', 'Sahiya', 'LaVierge', 'Mawmluh', 'Hoq']:
        axs[i].set_ylabel(u'$\delta^{18}$O (\u2030)', fontsize=12)
    else:
        axs[i].set_ylabel('')

    # Set x-axis and y-axis limits
    axs[i].set_xlim(-50, 10000)
    ymean = np.nanmean(series.value)
    axs[i].set_ylim(ymean - 2.4, ymean + 2.4)

    # Invert x-axis and y-axis
    axs[i].invert_xaxis()
    axs[i].invert_yaxis()

    # Set grid style and remove top and right spines
    axs[i].grid(linestyle='dotted')
    axs[i].spines['top'].set_visible(False)
    axs[i].spines['right'].set_visible(False)

    # Add series label to the plot
    axs[i].text(0.05, 0.13, key, transform=axs[i].transAxes, fontsize=14, color=clrs[i], weight='bold')