Figure 6#
import pickle
import random

import pyleoclim as pyleo
import matplotlib.pyplot as plt
from matplotlib import gridspec
import matplotlib.transforms as transforms
import matplotlib.patches as mpatches
import seaborn as sns
import numpy as np
import ammonyte as amt

from matplotlib.gridspec import GridSpec
from tqdm import tqdm
from pylipd.lipd import LiPD
#We suppress warnings for these notebooks for presentation purposes. Best practice is to not do this though.
import warnings
warnings.filterwarnings('ignore')
end_time=10000

lipd_path = './data/8k_ice'
record = 'NGRIP.NGRIP.2004'

d = LiPD()
d.load(f'{lipd_path}/{record}.lpd')
df = d.get_timeseries_essentials()
row = df[df['time_variableName']=='age']
lat = row['geo_meanLat'].to_numpy()[0]
lon = row['geo_meanLon'].to_numpy()[0]
elevation = row['geo_meanElev'].to_numpy()[0]
value = row['paleoData_values'].to_numpy()[0]
value_name = row['paleoData_variableName'].to_numpy()[0]
value_unit = row['paleoData_units'].to_numpy()[0]
time = row['time_values'].to_numpy()[0]
time_unit = row['time_units'].to_numpy()[0]
time_name = row['time_variableName'].to_numpy()[0]
label = row['dataSetName'].to_numpy()[0]
geo_series = pyleo.GeoSeries(time=time,
                            value=value,
                            lat=lat,
                            lon=lon,
                            elevation=elevation,
                            time_unit=time_unit,
                            time_name=time_name,
                            value_name=value_name,
                            value_unit=value_unit,
                            label=label,
                            archiveType='ice')

series = geo_series.copy()
series.time_unit = 'Years BP'
series = series.slice((0,end_time)).interp()
Loading 1 LiPD files
0%| | 0/1 [00:00<?, ?it/s]
0%| | 0/1 [00:00<?, ?it/s]
ERROR: Could not convert LiPD file ./data/8k_ice/NGRIP.NGRIP.2004.lpd to RDF
---------------------------------------------------------------------------
FileNotFoundError                         Traceback (most recent call last)
Cell In[3], line 7
      4 record = 'NGRIP.NGRIP.2004'
      6 d = LiPD()
----> 7 d.load(f'{lipd_path}/{record}.lpd')
      8 df = d.get_timeseries_essentials()
      9 row = df[df['time_variableName']=='age']

File ~/miniconda3/envs/ammonyte/lib/python3.10/site-packages/pylipd/lipd.py:141, in LiPD.load(self, lipdfiles, parallel)
    139 numfiles = len(lipdfiles)
    140 print(f"Loading {numfiles} LiPD files")
--> 141 self.graph = multi_load_lipd(self.graph, lipdfiles, parallel)
    142 print("Loaded..")

File ~/miniconda3/envs/ammonyte/lib/python3.10/site-packages/pylipd/utils/multi_processing.py:56, in multi_load_lipd(graph, lipdfiles, parallel)
     54 for i in tqdm(range(0, len(lipdfiles))):
     55     lipdfile = lipdfiles[i]
---> 56     subgraph = convert_lipd_to_graph(lipdfile)
     57     graph.addN(subgraph.quads())
     58     del subgraph

File ~/miniconda3/envs/ammonyte/lib/python3.10/site-packages/pylipd/utils/multi_processing.py:40, in convert_lipd_to_graph(lipdfile)
     38 except Exception as e:
     39     print(f"ERROR: Could not convert LiPD file {lipdfile} to RDF")
---> 40     raise e

File ~/miniconda3/envs/ammonyte/lib/python3.10/site-packages/pylipd/utils/multi_processing.py:36, in convert_lipd_to_graph(lipdfile)
     34 try:
     35     converter = LipdToRDF()
---> 36     converter.convert(lipdfile)
     37     return converter.graph
     38 except Exception as e:

File ~/miniconda3/envs/ammonyte/lib/python3.10/site-packages/pylipd/utils/lipd_to_rdf.py:61, in LipdToRDF.convert(self, lipdpath)
     58 self.graphurl = NSURL + "/" + lpdname
     60 with tempfile.TemporaryDirectory(prefix="lipd_to_rdf_") as tmpdir:
---> 61     self._unzip_lipd_file(lipdpath, tmpdir)
     62     jsons = self._find_files_with_extension(tmpdir, 'jsonld')
     63     for jsonpath, _ in jsons:

File ~/miniconda3/envs/ammonyte/lib/python3.10/site-packages/pylipd/utils/lipd_to_rdf.py:108, in LipdToRDF._unzip_lipd_file(self, lipdfile, unzipdir)
    104         zip_ref.extractall(unzipdir)
    105 else:
    106     # If this is a local file
    107     # Unzip file
--> 108     with zipfile.ZipFile(lipdfile, 'r') as zip_ref:
    109         zip_ref.extractall(unzipdir)

File ~/miniconda3/envs/ammonyte/lib/python3.10/zipfile.py:1251, in ZipFile.__init__(self, file, mode, compression, allowZip64, compresslevel, strict_timestamps)
   1249 while True:
   1250     try:
-> 1251         self.fp = io.open(file, filemode)
   1252     except OSError:
   1253         if filemode in modeDict:

FileNotFoundError: [Errno 2] No such file or directory: './data/8k_ice/NGRIP.NGRIP.2004.lpd'
level=4
m=13
eps=1
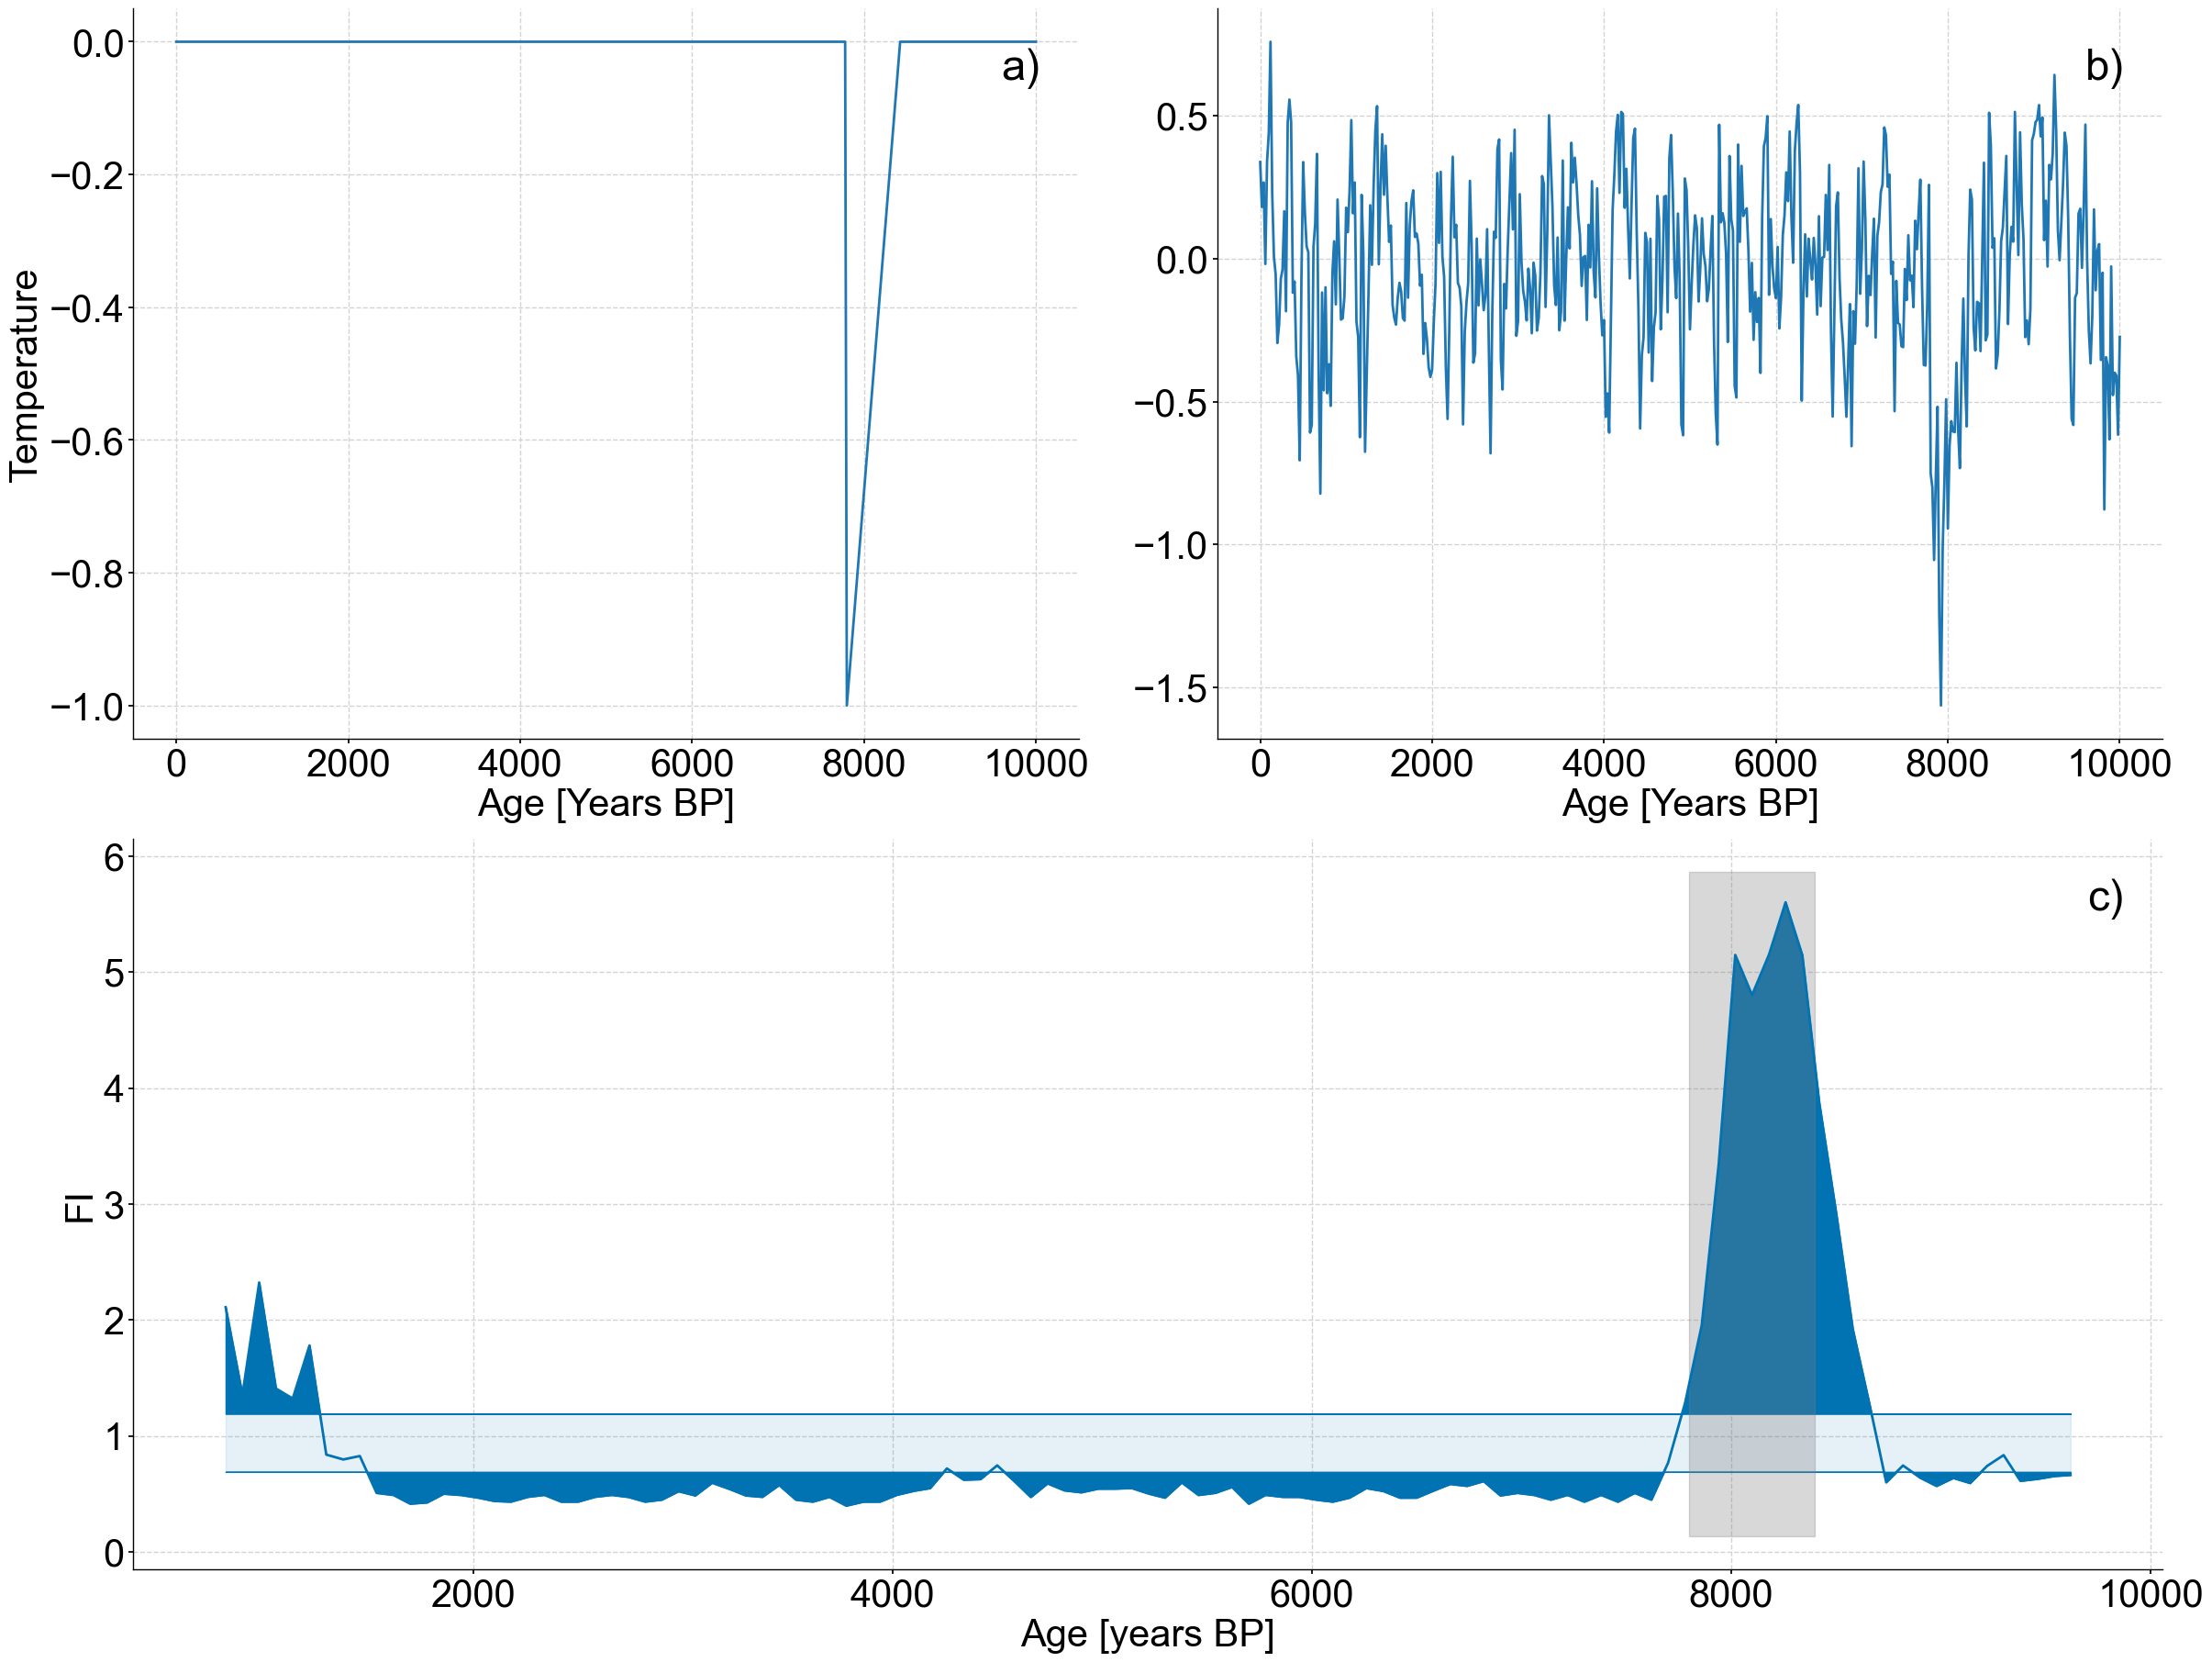
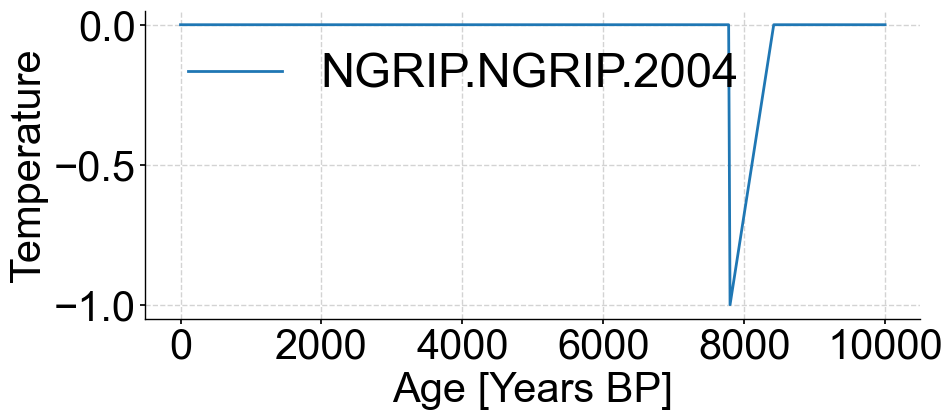
spike_series = series.copy()
spike_series.value = np.zeros(len(spike_series.value))
index = np.where((spike_series.time >= 7800) & (spike_series.time <= 8400))[0]
spike = -1+(1/len(index))*np.arange(len(index))
spike_series.value[index] += spike
success_counter=0
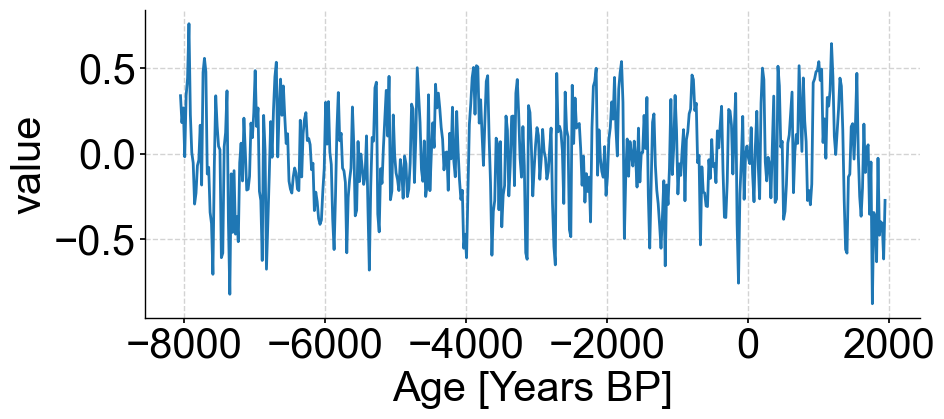
noise_series = pyleo.Series(*pyleo.utils.gen_ts(model='ar1',t=spike_series.time,scale=1/level)).convert_time_unit('Years BP')
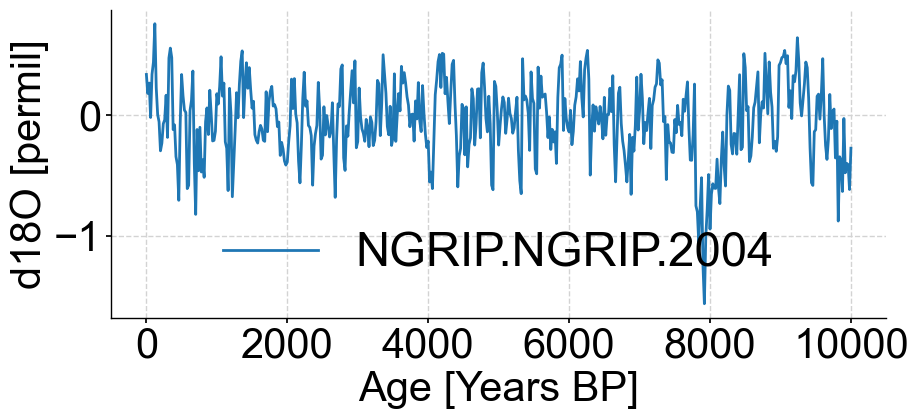
noisy_spike = spike_series.copy()
noisy_spike.value += noise_series.value
apply_series=noisy_spike.convert_time_unit('Years')
amt_series = amt.Series(
time=apply_series.time,
value=apply_series.value,
time_name = apply_series.time_unit,
value_name = apply_series.value_name,
time_unit = apply_series.time_unit,
value_unit = apply_series.value_unit,
label = apply_series.label,
sort_ts=None
)
td = amt_series.embed(m=m)
eps_res = td.find_epsilon(eps=eps,target_density=.05,tolerance=.01)
print(f'Tau is {td.tau}')
rm = eps_res['Output']
lp_series = rm.laplacian_eigenmaps(w_size=20,w_incre=4)
lp_series = lp_series.convert_time_unit('years BP')
Time axis values sorted in ascending order
Initial density is 0.0495
Initial density is within the tolerance window!
Tau is 3
/var/folders/5k/0y4jsz592qq0y78c_0ddgcpm0000gn/T/ipykernel_16039/494794242.py:11: UserWarning: auto_time_params is not specified. Currently default behavior sets this to True. In a future release this will be changed to False.
  noise_series = pyleo.Series(*pyleo.utils.gen_ts(model='ar1',t=spike_series.time,scale=1/level)).convert_time_unit('Years BP')
/var/folders/5k/0y4jsz592qq0y78c_0ddgcpm0000gn/T/ipykernel_16039/494794242.py:11: UserWarning: No time_unit parameter provided. Assuming years CE.
  noise_series = pyleo.Series(*pyleo.utils.gen_ts(model='ar1',t=spike_series.time,scale=1/level)).convert_time_unit('Years BP')
/var/folders/5k/0y4jsz592qq0y78c_0ddgcpm0000gn/T/ipykernel_16039/494794242.py:11: UserWarning: No time_name parameter provided. Assuming "Time".
  noise_series = pyleo.Series(*pyleo.utils.gen_ts(model='ar1',t=spike_series.time,scale=1/level)).convert_time_unit('Years BP')
/var/folders/5k/0y4jsz592qq0y78c_0ddgcpm0000gn/T/ipykernel_16039/494794242.py:16: UserWarning: auto_time_params is not specified. Currently default behavior sets this to True. In a future release this will be changed to False.
  amt_series = amt.Series(
/Users/alexjames/Documents/GitHub/Ammonyte/ammonyte/core/rqa_res.py:22: UserWarning: auto_time_params is not specified. Currently default behavior sets this to True. In a future release this will be changed to False.
  super().__init__(time,value,time_name,time_unit,value_name,value_unit,label,sort_ts=None)
/Users/alexjames/Documents/GitHub/Ammonyte/ammonyte/core/rqa_res.py:22: UserWarning: No time_name parameter provided. Assuming "Time".
  super().__init__(time,value,time_name,time_unit,value_name,value_unit,label,sort_ts=None)
fig,ax=spike_series.plot()

ax.set_ylabel('Temperature')
Text(0, 0.5, 'Temperature')
noise_series.plot()
(<Figure size 1000x400 with 1 Axes>,
 <Axes: xlabel='Age [Years BP]', ylabel='value'>)
noisy_spike.plot()
(<Figure size 1000x400 with 1 Axes>,
 <Axes: xlabel='Age [Years BP]', ylabel='d18O [permil]'>)
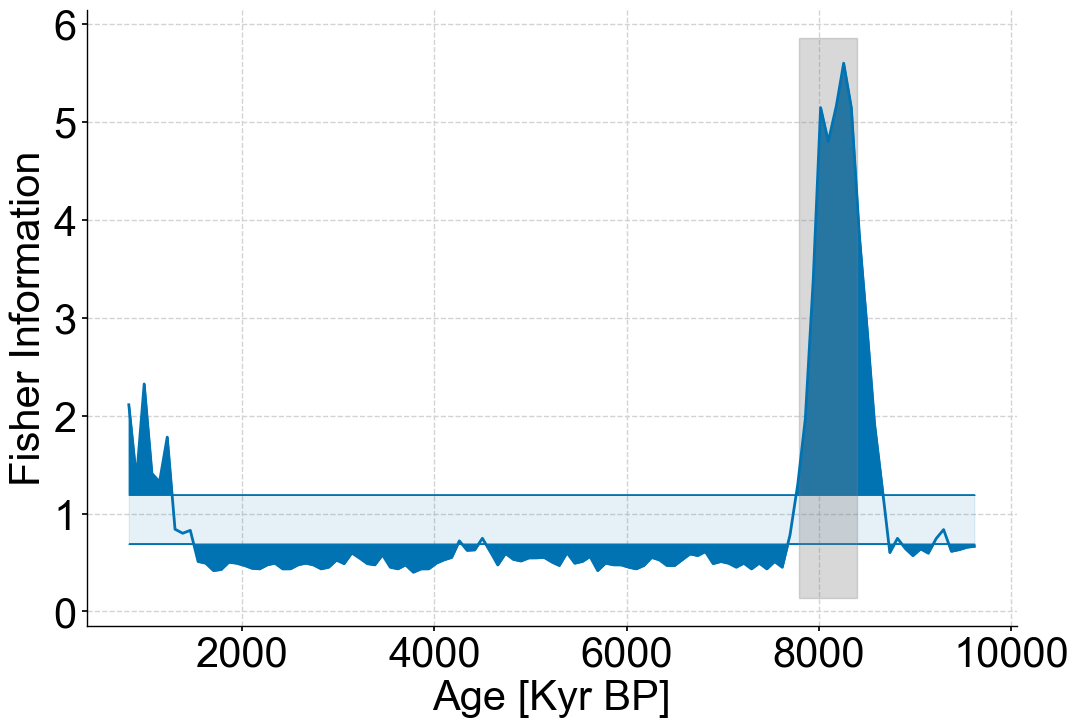
fig,ax=lp_series.confidence_fill_plot()

ax.set_ylabel('Fisher Information')
ax.set_xlabel('Age [Kyr BP]')
ylim=ax.get_ylim()
ax.fill_betweenx(ylim,7800,8400,color='grey',alpha=.3)
ax.legend().set_visible(False)
#Production figure

SMALL_SIZE = 30
MEDIUM_SIZE = 30
BIGGER_SIZE = 34

plt.rc('font', size=SMALL_SIZE)          # controls default text sizes
plt.rc('axes', titlesize=MEDIUM_SIZE)     # fontsize of the axes title
plt.rc('axes', labelsize=MEDIUM_SIZE)    # fontsize of the x and y labels
plt.rc('xtick', labelsize=MEDIUM_SIZE)    # fontsize of the tick labels
plt.rc('ytick', labelsize=MEDIUM_SIZE)    # fontsize of the tick labels
plt.rc('legend', fontsize=BIGGER_SIZE)    # legend fontsize
plt.rc('figure', titlesize=BIGGER_SIZE)  # fontsize of the figure title


fig = plt.figure(constrained_layout=True,figsize=(24,18))
gs = GridSpec(2, 2, figure=fig)

# create sub plots as grid
ax1 = fig.add_subplot(gs[0, 0])
ax2 = fig.add_subplot(gs[0, 1])
ax3 = fig.add_subplot(gs[1, :])

spike_series.plot(ax=ax1,legend=False,ylabel='Temperature')
patch = mpatches.Patch(fc="w", fill=False, edgecolor='none', linewidth=0,label='a)')
ax1.legend(handles=[patch],loc='upper right')

noisy_spike.plot(ax=ax2,legend=False,ylabel='')
patch = mpatches.Patch(fc="w", fill=False, edgecolor='none', linewidth=0,label='b)')
ax2.legend(handles=[patch],loc='upper right')

lp_series.confidence_fill_plot(ax=ax3,legend=None,ylabel='FI')
ax3.fill_betweenx(ylim,7800,8400,color='grey',alpha=.3)
patch = mpatches.Patch(fc="w", fill=False, edgecolor='none', linewidth=0,label='c)')
ax3.legend(handles=[patch],loc='upper right')
<matplotlib.legend.Legend at 0x298704df0>