Sensitivity to resolution#
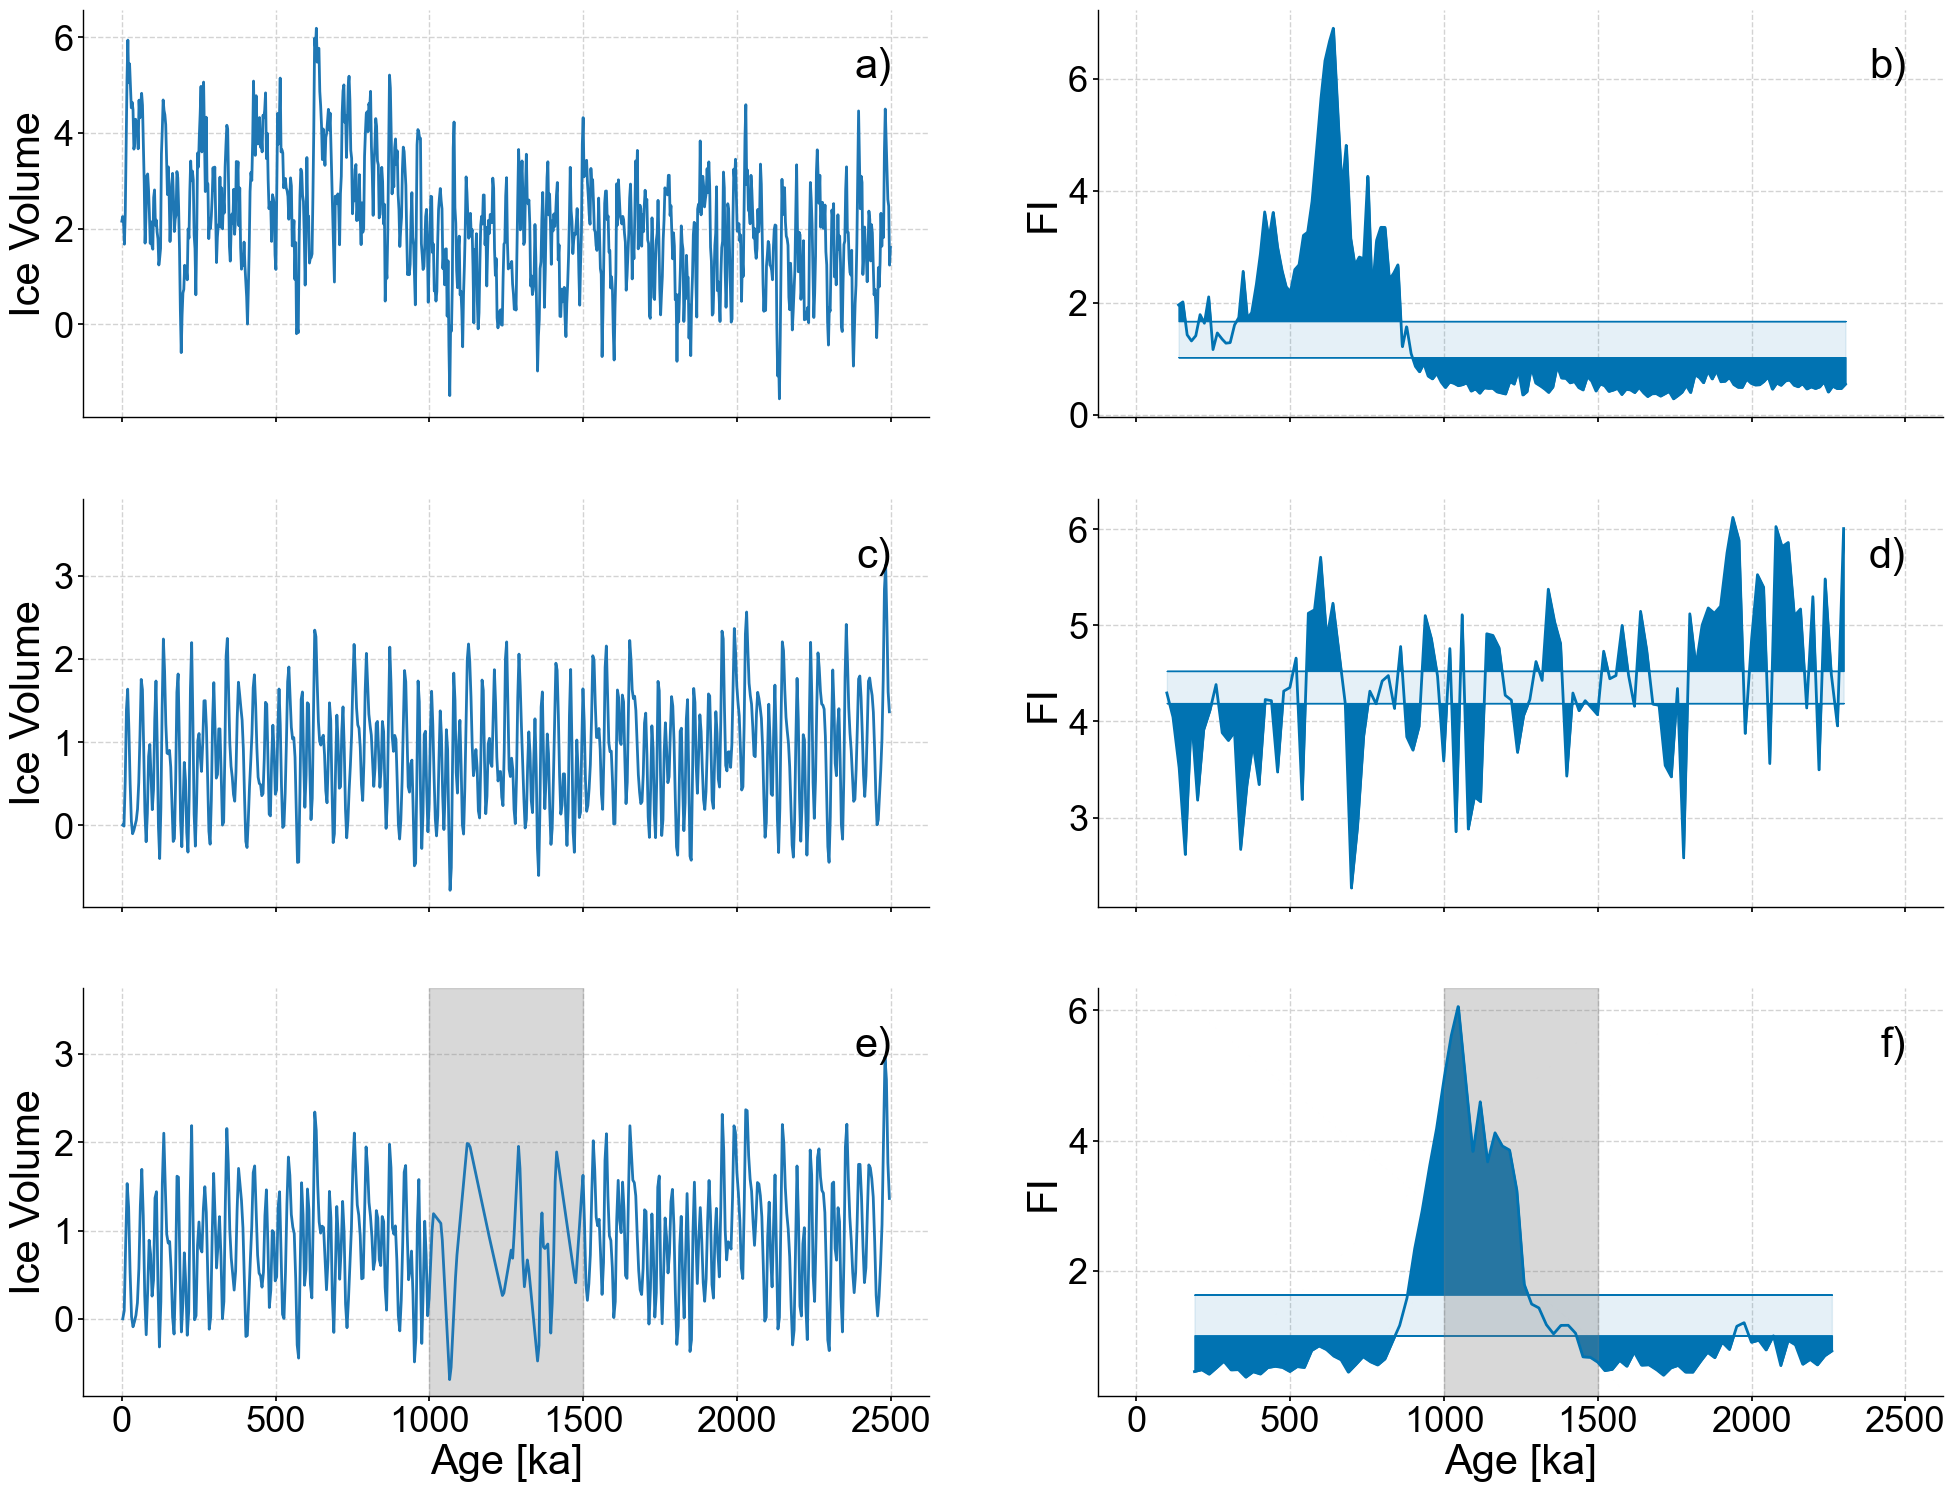
This notebook recreates Figure 4 from the original publication, testing LERM’s sensitivity to resolution changes.
import pickle
import random

import pyleoclim as pyleo
import matplotlib.pyplot as plt
import matplotlib.patches as mpatches
import seaborn as sns
import numpy as np
import ammonyte as amt
/Users/alexjames/miniconda3/envs/ammonyte/lib/python3.10/site-packages/pandas/core/arrays/masked.py:60: UserWarning: Pandas requires version '1.3.6' or newer of 'bottleneck' (version '1.3.5' currently installed).
  from pandas.core import (
#We suppress warnings for these notebooks for presentation purposes. Best practice is to not do this though.
import warnings
warnings.filterwarnings('ignore')
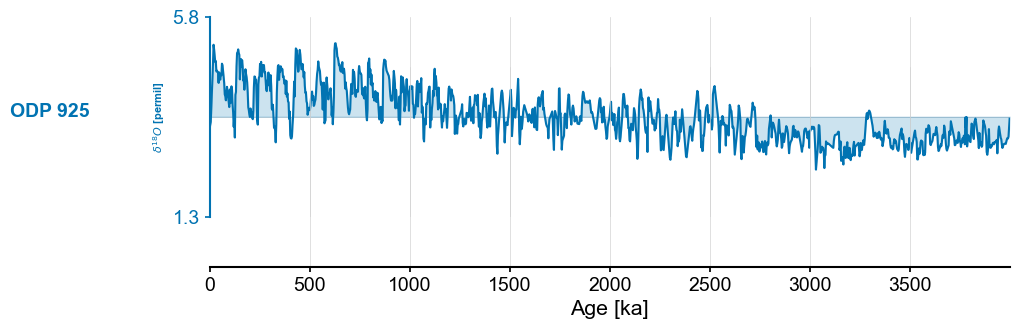
Top Panel#
#Defining group lists for easy loading
group_names = ['ODP 925']
series_list = []
color_list = sns.color_palette('colorblind')

for name in group_names:
    with open('../data/LR04cores_spec_corr/'+name[-3:]+'_LR04age.txt','rb') as handle:
        lines = handle.readlines()
        time = []
        d18O = []
        for x in lines:
            line_time = float(format(float(x.decode().split()[1]),'10f'))
            line_d18O = float(format(float(x.decode().split()[2]),'10f'))
            #There is a discontinuity in 927 around 4000 ka, we'll just exclude it
            if line_time <= 4000:
                time.append(line_time)
                d18O.append(line_d18O)
        series = pyleo.Series(value=d18O,
                              time=time,
                              label=name,
                              time_name='Yr',
                              time_unit='ka',
                              value_name=r'$\delta^{18}O$',
                              value_unit='permil')
    series_list.append(series)

max_time = min([max(series.time) for series in series_list])
min_time = max([min(series.time) for series in series_list])

ms = pyleo.MultipleSeries([series.slice((min_time,max_time)).interp() for series in series_list])
fig,ax = ms.stackplot(colors=color_list[:len(ms.series_list)],figsize=(8,2*len(ms.series_list)))
Time axis values sorted in ascending order
with open('../data/0_2500_I65_staged.pkl','rb') as handle:
    initial_series = pickle.load(handle)
odp_series = ms.series_list[0]
binned_series = initial_series.bin(time_axis=odp_series.time) # Binning synthetic data onto the time axis of ODP 925
def noise_test(series,sn_ratio=1,m=13,tau=None,w_size=50,w_incre=5,find_eps_kwargs=None):
    """Run a noise test

    Parameters
    ----------

    series : pyleo.Series
        Series on which to apply noise test

    sn_ratio : float
        Signal to noise ratio to use.
        Note that signal to noise is defined as the standard deviation of the series
        divided by the standard deviation of the noise

    m : int
        Embedding dimension

    tau : int
        Time delay embedding

    w_size : int
        Window size

    w_incre : int
        Window increment

    find_eps_kwargs : dict
        Dictionary of arguments for amt.TimeEmbeddedSeries.find_epsilon"""

    find_eps_kwargs = {} if find_eps_kwargs is None else find_eps_kwargs.copy()
    if 'eps' not in find_eps_kwargs:
        find_eps_kwargs['eps'] = 1

    noise_time,noise_value = pyleo.utils.gen_ts(model='ar1',t=series.time,scale=series.stats()['std']/sn_ratio) # Create AR1 series with appropriate standard deviation
    noise = pyleo.Series(noise_time,noise_value,label='Noise Series',sort_ts=None) # Create noise series
    real_sn_ratio = series.stats()['std']/noise.stats()['std'] # Calculate actual S/N ratio as sanity check
    noisy_series = series.copy()
    noisy_series.value += noise.value
    amt_series = amt.Series(
        time=noisy_series.time,
        value=noisy_series.value,
        time_name = noisy_series.time_name,
        value_name = noisy_series.value_name,
        time_unit = noisy_series.time_unit,
        value_unit = noisy_series.value_unit,
        label = noisy_series.label,
        sort_ts=None
    )
    amt_series.convert_time_unit('Years')
    td = amt_series.embed(m)

    eps = td.find_epsilon(**find_eps_kwargs)
    rm = eps['Output']
    lp_series = rm.laplacian_eigenmaps(w_size=w_size,w_incre=w_incre)
    lp_series.convert_time_unit('ka')

    return lp_series, noisy_series, real_sn_ratio
sn_ratio = 2
find_eps_kwargs = {'eps':5}
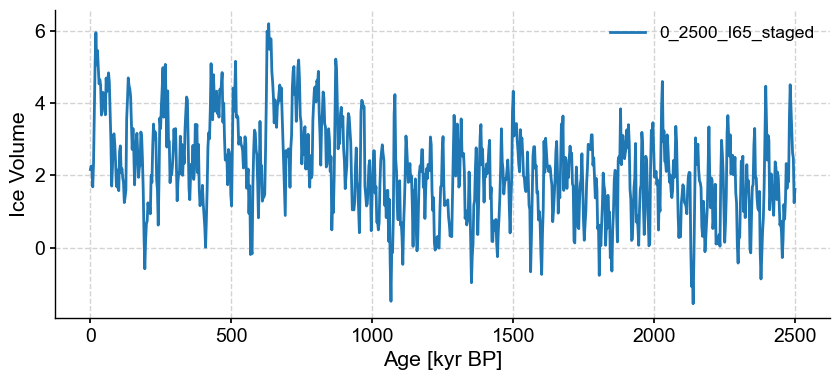
# Here we use the noise_test function to carry out tests on the effect of the inclusion of noise.
# This function uses a default embedding dimension of 13, picks tau according to the first minimum of mutual information, and uses a default window size of 50 and window increment of 5
lp_series_2,noisy_series_2,real_sn_ratio_2 = noise_test(binned_series,
sn_ratio=sn_ratio,
find_eps_kwargs=find_eps_kwargs)
NaNs have been detected and dropped.
Initial density is 0.1851
Initial density is not within the tolerance window, searching...
Epsilon: 3.6487, Density: 0.0224
Epsilon: 3.9249, Density: 0.0376
Epsilon: 4.0493, Density: 0.0468
Epsilon: 4.0493, Density: 0.0468.
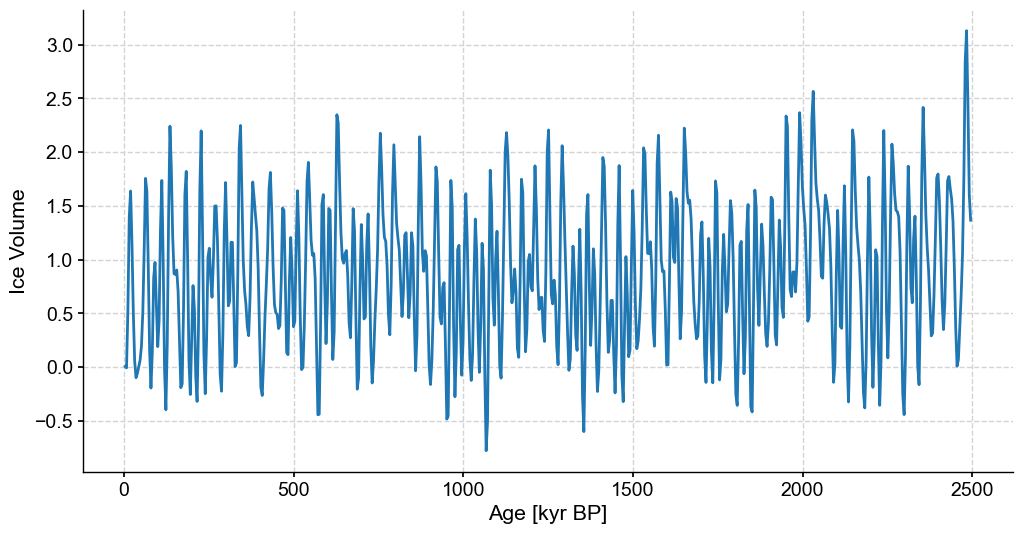
noisy_series_2.plot()
(<Figure size 1000x400 with 1 Axes>,
 <Axes: xlabel='Age [kyr BP]', ylabel='Ice Volume'>)
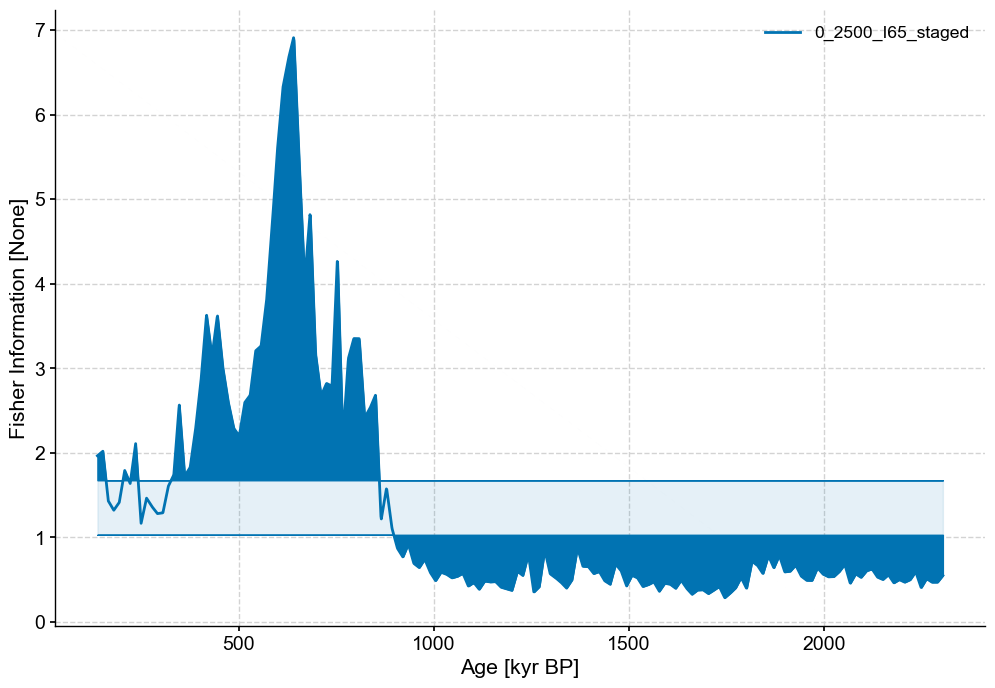
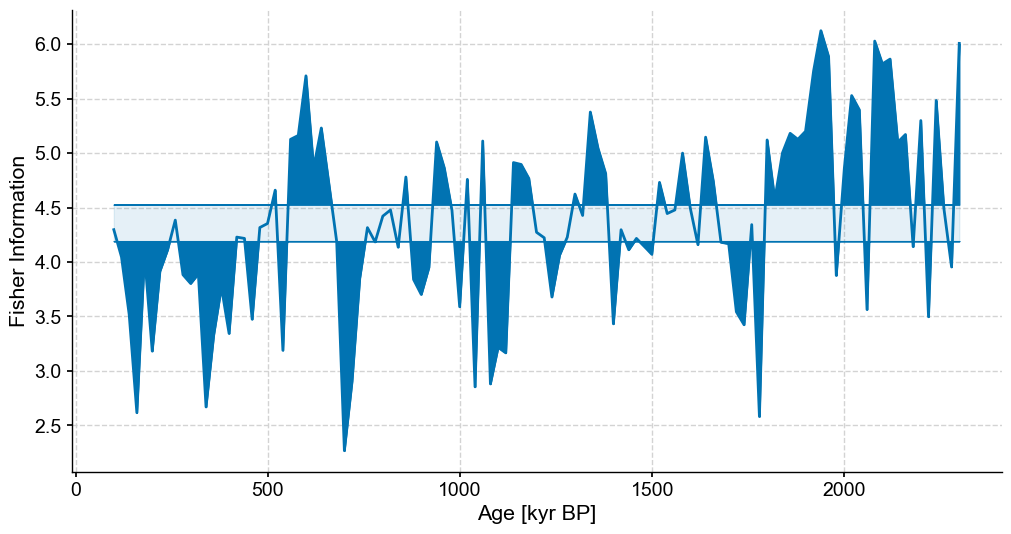
lp_series_2.confidence_fill_plot()
(<Figure size 1200x800 with 1 Axes>,
 <Axes: xlabel='Age [kyr BP]', ylabel='Fisher Information [None]'>)
Middle panel#
with open('../data/0_2500_I65_stable.pkl','rb') as handle:
    initial_series = pickle.load(handle)
stable_series = initial_series.bin(bin_size=4)
stable_series.label = 'Stable Series'
fig,ax = stable_series.plot(figsize=(12,6),legend=False)
series = stable_series
m=12 # Embedding dimension

amt_series = amt.Series(
    time=series.time,
    value=series.value,
    time_name = series.time_name,
    value_name = series.value_name,
    time_unit = series.time_unit,
    value_unit = series.value_unit,
    label = series.label,
    clean_ts=False
).convert_time_unit('Years')
td = amt_series.embed(m) # Pick tau according to first minimum of mutual info
eps = td.find_epsilon(1,.05,.01,parallelize=False) # Find epsilon that create recurrence matrix with density of 5% plus or minus 1%. Initial guess at epsilon is 1.
rm = eps['Output']
lp_stable = rm.laplacian_eigenmaps(50,5).convert_time_unit('ka') # Window size and window increment of 50 and 5 respectively
Time axis values sorted in ascending order
Initial density is 0.0022
Initial density is not within the tolerance window, searching...
Epsilon: 1.4781, Density: 0.0099
Epsilon: 1.8789, Density: 0.0401
Epsilon: 1.8789, Density: 0.0401.
fig,ax = plt.subplots(figsize=(12,6))

lp_stable.confidence_fill_plot(ax=ax,legend=False)
ax.set_ylabel('Fisher Information')
ax.set_xlabel('Age [kyr BP]')
Text(0.5, 0, 'Age [kyr BP]')
Bottom panel#
def remove_values(series,percent,seed=42,subset=None):
    '''Function to remove values at random

    Note that this currently assumes units of Years BP

    Parameters
    ----------

    series : pyleoclim.Series
        Series to remove values from

    percent : float
        Percentage of values to remove. Should be between 0 and 100

    seed : int
        Random seed to use

    subset : list
        [Start,stop] time indices for section of series you wish to be randomly coarsened.
        If not passed, the whole series will be coarsened

    Returns
    -------

    sparse_series : pyleoclim.Series
    '''

    random.seed(seed)
    sparse_series = series.copy()

    if subset:
        sparse_slice = series.slice(subset)
        sparse_index = np.where((series.time >= sparse_slice.time[0]) & (series.time <= sparse_slice.time[-1]))[0]
        num_drop = int(len(sparse_slice.time) * (percent/100))
        index_drop = sorted(random.sample(range(sparse_index[0],sparse_index[-1]), num_drop))
        time = np.delete(series.time,index_drop)
        value = np.delete(series.value,index_drop)
        sparse_series.time = time
        sparse_series.value = value

    else:
        num_drop = int(len(series.time) * (percent/100))
        index_drop = sorted(random.sample(range(len(series.time)), num_drop))
        time = np.delete(series.time,index_drop)
        value = np.delete(series.value,index_drop)
        sparse_series.time = time
        sparse_series.value = value

    return sparse_series
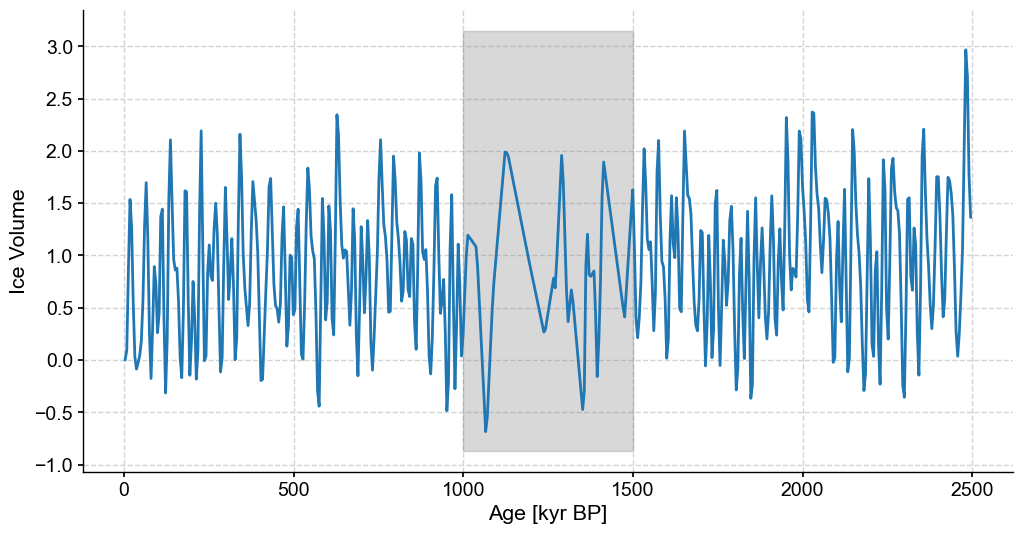
bounds = [1000,1500]

coarse_series = remove_values(series=stable_series,percent=80,subset=bounds).interp() #Artificially coarsening our stable synthetic data by removing 80% of values between specified bounds
fig,ax = coarse_series.plot(legend=False,figsize=(12,6))

ylim=ax.get_ylim()
ax.fill_betweenx(ylim,min(bounds),max(bounds),color='grey',alpha=.3,label='Coarse Section')
<matplotlib.collections.PolyCollection at 0x177d19780>
series = coarse_series.interp()
m=12

amt_series = amt.Series(
    time=series.time,
    value=series.value,
    time_name = series.time_name,
    value_name = series.value_name,
    time_unit = series.time_unit,
    value_unit = series.value_unit,
    label = series.label,
    clean_ts=False
).convert_time_unit('Years')
td = amt_series.embed(m=m)
eps = td.find_epsilon(eps=1,target_density=.05,tolerance=.01)
print(f'Tau is {td.tau}')
rm = eps['Output']
lp_coarse = rm.laplacian_eigenmaps(50,5).convert_time_unit('ka')
Time axis values sorted in ascending order
Initial density is 0.0029
Initial density is not within the tolerance window, searching...
Epsilon: 1.4708, Density: 0.0115
Epsilon: 1.8557, Density: 0.0470
Epsilon: 1.8557, Density: 0.0470.
Tau is 3
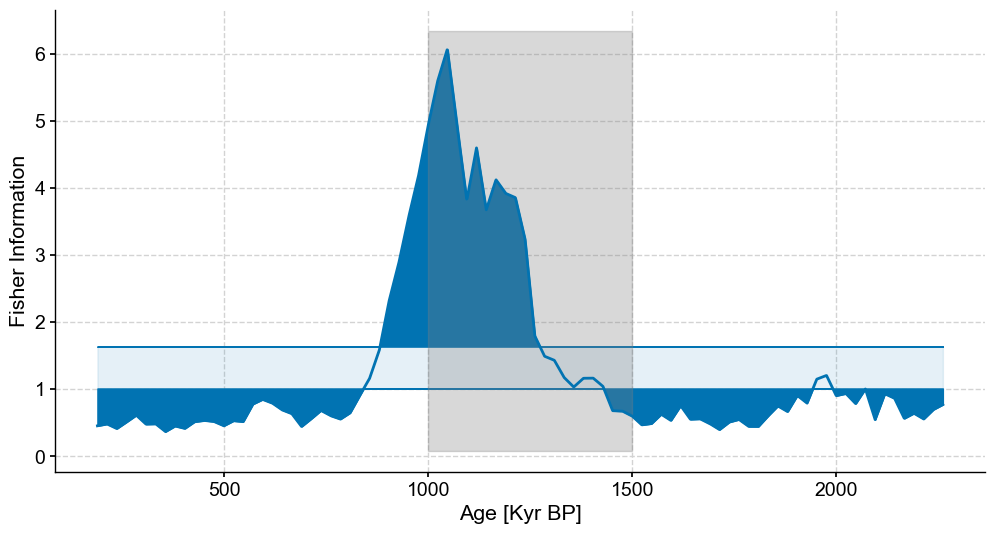
fig,ax = plt.subplots(figsize=(12,6))

lp_coarse.confidence_fill_plot(ax=ax,legend=False)
ylim = ax.get_ylim()
ax.fill_betweenx(ylim,min(bounds),max(bounds),color='grey',alpha=.3,label='Coarse Section')
ax.set_ylabel('Fisher Information')
ax.set_xlabel('Age [Kyr BP]')
Text(0.5, 0, 'Age [Kyr BP]')
Full figure#
# Production figure

SMALL_SIZE = 26
MEDIUM_SIZE = 26
BIGGER_SIZE = 30

plt.rc('font', size=SMALL_SIZE)          # controls default text sizes
plt.rc('axes', titlesize=MEDIUM_SIZE)     # fontsize of the axes title
plt.rc('axes', labelsize=BIGGER_SIZE)    # fontsize of the x and y labels
plt.rc('xtick', labelsize=MEDIUM_SIZE)    # fontsize of the tick labels
plt.rc('ytick', labelsize=MEDIUM_SIZE)    # fontsize of the tick labels
plt.rc('legend', fontsize=BIGGER_SIZE)    # legend fontsize
plt.rc('figure', titlesize=BIGGER_SIZE)  # fontsize of the figure title

fig,axes = plt.subplots(nrows=3,ncols=2,sharex=True,figsize=(24,18))

noisy_series_2.plot(ax=axes[0,0],legend=None,xlabel='')
patch = mpatches.Patch(fc="w", fill=False, edgecolor='none', linewidth=0,label='a)')
axes[0,0].legend(handles=[patch],loc='upper right')

lp_series_2.confidence_fill_plot(ax=axes[0,1],legend=None,xlabel='',ylabel='FI')
patch = mpatches.Patch(fc="w", fill=False, edgecolor='none', linewidth=0,label='b)')
axes[0,1].legend(handles=[patch],loc='upper right')

stable_series.plot(ax=axes[1,0],legend=None,xlabel='')
ylim=list(axes[1,0].get_ylim())
ylim[1]+=.6
axes[1,0].set_ylim(ylim)
patch = mpatches.Patch(fc="w", fill=False, edgecolor='none', linewidth=0,label='c)')
axes[1,0].legend(handles=[patch],loc='upper right')

lp_stable.confidence_fill_plot(ax=axes[1,1],legend=None,xlabel='',ylabel='FI')
patch = mpatches.Patch(fc="w", fill=False, edgecolor='none', linewidth=0,label='d)')
axes[1,1].legend(handles=[patch],loc='upper right')

coarse_series.plot(ax=axes[2,0],legend=None,xlabel='Age [ka]')
ylim=list(axes[2,0].get_ylim())
ylim[1]+=.6
axes[2,0].fill_betweenx(ylim,min(bounds),max(bounds),color='grey',alpha=.3,label='Coarse Section')
axes[2,0].set_ylim(ylim)
patch = mpatches.Patch(fc="w", fill=False, edgecolor='none', linewidth=0,label='e)')
axes[2,0].legend(handles=[patch],loc='upper right')

lp_coarse.confidence_fill_plot(ax=axes[2,1],legend=None,ylabel='FI')
ylim=axes[2,1].get_ylim()
axes[2,1].fill_betweenx(ylim,min(bounds),max(bounds),color='grey',alpha=.3,label='Coarse Section')
axes[2,1].set_ylim(ylim)
patch = mpatches.Patch(fc="w", fill=False, edgecolor='none', linewidth=0,label='f)')
axes[2,1].legend(handles=[patch],loc='upper right')
<matplotlib.legend.Legend at 0x283fb38b0>